MedCalc 23.5.2

Description: MedCalc is a statistical software package for biomedical research. Includes more than 220 statistical tests, procedures and graphs. ROC curve analysis, method comparison and quality control tools. Minimal learning curve. Developed since 1993.
Easy to learn, fast and reliable
MedCalc includes more than 220 statistical tests, procedures and graphs
save graphs in SVG, PNG, JPG, high resolution TIF, or other file formats, or as PowerPoint slides (*.pptx).
free updates
available with an English, Chinese (simplified and traditional), French, German, Italian, Japanese, Korean, Polish, Portuguese (Brazilian), Russian and Spanish user-interface (help file and documentation in English)
one edition includes all features (do not pay extra for the functions you really need).
compatible with all contemporary Windows desktop editions
Data management
Integrated spreadsheet with 1 048 576 rows and 16 384 columns.
Correct handling of missing data.
Outliers can easily be excluded.
Built-in WYSIWYG text editor.
Imports Excel, Excel 2007, SPSS, DBase and Lotus files, and files in SYLK, DIF or plain text format.
Easy selection of subgroups for statistical analysis.
MedCalc Documentation
Complete HTML manual on MedCalc web site.
Comprehensive context-sensitive help.
Context help in dialog boxes.
ROC curve analysis
MedCalc is the reference software for ROC curve analysis. Our ROC curve analysis module includes:
Area Under the Curve (AUC) with standard error, 95% confidence interval, P-value. Offers choice between methodology of DeLong et al. (1988) and Hanley & McNeil (1982, 1983).
List of sensitivity, specificity, likelihood ratios, and positive and negative predictive values for all possible threshold values.
ROC curve graph with 95% Confidence Bounds.
Threshold values can be selected in an interactive dot diagram with automatic calculation of corresponding sensitivity and specificity.
Plot of sensitivity and specificity, or cost, versus criterion values.
Plot of predictive values versus prevalence.
Interval likelihood ratios.
Comparison of up to 6 ROC curves: difference between the areas under the ROC curves, with standard error, 95% confidence interval and P-value.
Sample size calculation for area under ROC curve and comparison of ROC curves.
Go to the ROC curve analysis section of the MedCalc manual for more information on ROC curve analysis in MedCalc.
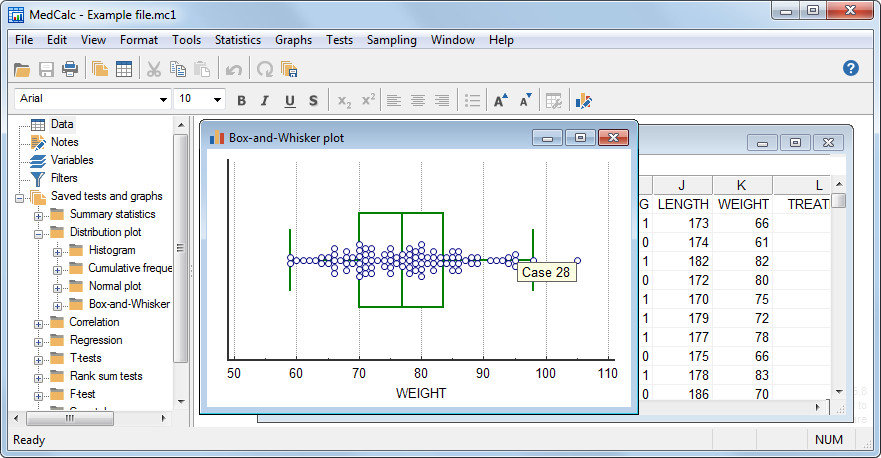
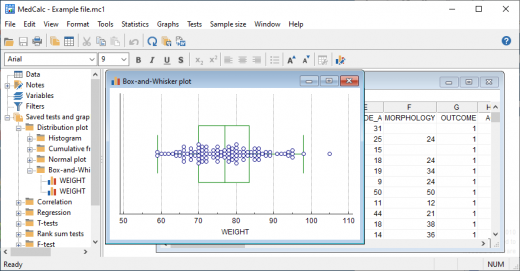
Graphs
Lots of graphs, see Graph gallery.
Data point identification in graphs.
Draw text boxes, lines, arrows and connectors.
Name, save and recall graphs and statistics.
Statistical info in graph windows.
Save graphs as SVG, PNG, JPG, GIF, BMP, PCX, or high resolution TIF files, or as PowerPoint slides (*.pptx).
Release Name: MedCalc 23.5.2
Size: 171 MB
Links: HOMEPAGE – NFO – Torrent Search
Download: RAPiDGATOR