Description: .NET Profiler: Debug, Analyze & Fix Performance Issues. The powerful line level sampling profiler provides functionality to pinpoint performance bottlenecks within the app. In contrast to a classic .NET profiler, our software allows the user to analyze processes with native code. Thus, performance issues triggered by native code can be identified, for instance from 3rd party libraries like the .NET runtime.
In addition, the tool supports event tracing to maximize the user experience. File I/O activity, network activity and debug events can be captured. That way interesting app insights can be correlated with the timeline. Data context information can be added to investigate internals of apps beyond code level.
The built-in timeline functionality empowers the user to process interesting time ranges.
Resolve Memory & Resource Leaks
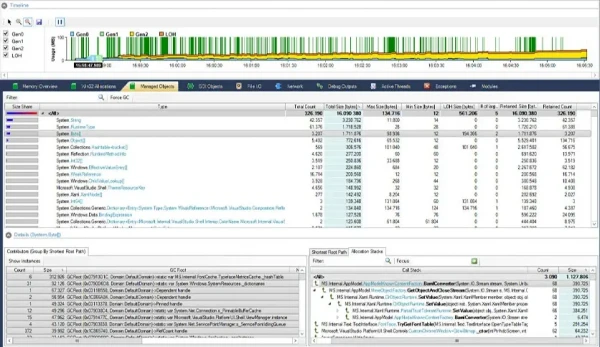
The integrated .NET memory profiler empowers the user to identify the root causes for memory issues and resource leaks. The memory profiler is fast with minimal overhead in regards to memory consumption and execution times. Allocation stack recording is quite fast.
Our tool trumps classic .NET memory profilers with outstanding features:
Memory overview (Managed Heap, Win32 Heap, Modules, Mapped Files, Stacks, etc) to get the big picture.
Tracking of memory and resource issues triggered from native code including the .NET runtime.
Capture of Win32 allocations from any 3rd party code to investigate memory leaks from native code.
GDI Resource Tracking: Use the resource profiling information to identity resource leaks (bitmaps, fonts, brushes, DCs etc). Fix the found leaks with the help of resource allocation trigger stacks.
Tracking of file mapping events which can contribute multiple gigabytes of memory usage for a single process. As a result your app will experience sluggish performance. Here, a classic profiler will not give you any clue why your app runs into issues.
Analysis of crash (memory) dump files.
Analyze Slow Database Queries and Other Issues
The built-in application event tracker captures interesting system and application event topics. For each traced event, the profiler provides timestamps and thread stacks information. For this purpose, the profiler can record both managed and native event triggers.
Of course, the tool can capture event activity with data context and error information, for instance:
Network activity tracing: View WCF calls, Database queries, Web access with source and target endpoints
File I/O activity including named pipes: View .NET Remoting / WCF calls. Vieew performed read/write operations with actual data read/written.
Startup-Performance optimizer: Analyze root causes of just in time (JIT) compilations, module relocations.
Concurrency analyzer (threading events with trigger stacks, lock usage) to pinpoint threading usage.
Release Name: Perfinity dotNET Runtime Analyzer 9.0.21
Size: 190.4 MB
Links: HOMEPAGE – NFO – Torrent Search
Download: RAPiDGATOR